User Guide
Acupuncture Effect Data Visualization Platform is constructed by Institute of Information on Traditional Chinese Medicine, China Academy of Chinese Medical Sciences. Based on the literature database of acupuncture effect, it will display acupuncture intervention data (needles, acupuncture manipulation, needle sites, courses of treatment, etc.) and acupuncture effect information (functional score, microscopic function, tissue or cell level, molecular level, etc.) in detail. The database is divided into three modules, including 14,284 articles from 1956 to 2019 in the acupuncture animal experiment module, 11,472 articles from 1956 to 2016 in the acupuncture randomized controlled trial module, and 2,107 articles from 1956 to 2019 in the acupuncture basic clinical experiment module respectively. The platform can support the retrieval and screening of literature, and provide five search portals of disease syndrome, acupoint, effect, therapy, and tissues or organs, so as to accurately screen literature data. At the same time, the platform provides 3 visualization methods, including tree mode, circle mode, and mesh mode, using knowledge network to display the relationship of disease, acupoints, genes, proteins, detection indicators, cell or tissue and other interrelated elements.
User registration

Click the "Register" button and enter the user information in the registration window.
After the registration is successful, the system prompts "Registration succeeded. Log in to the registered mailbox to activate the account.
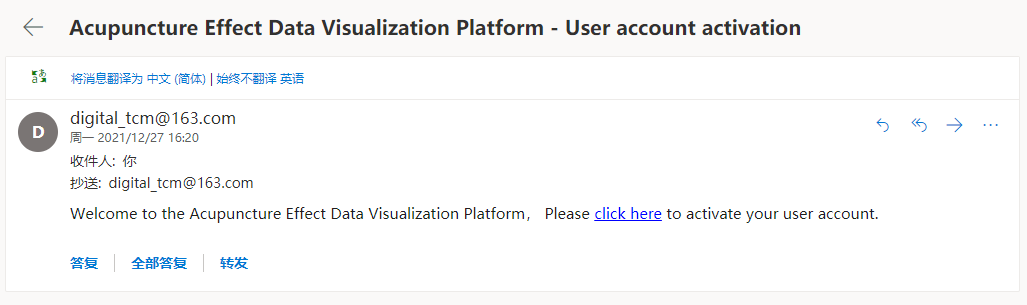
Log in to the registered mailbox to view the activation mail.
Click the user activation link.
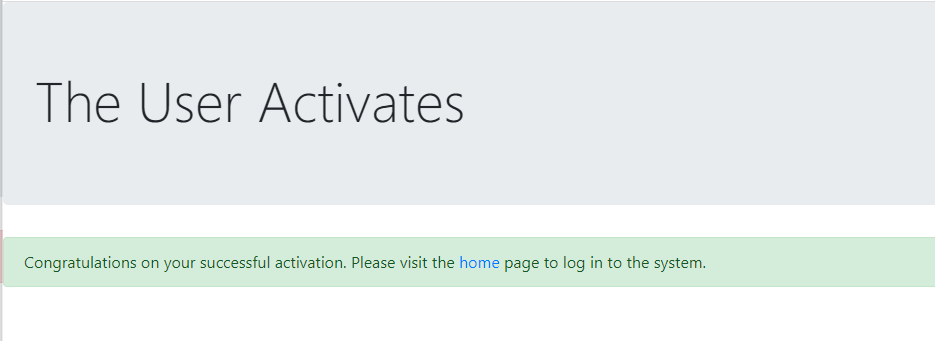
The system prompts that the account has been activated successfully. Return to the home page to log in to the system.
Congratulations, you can use Acupuncture Effect Data Visualization Platform.
User login/logout
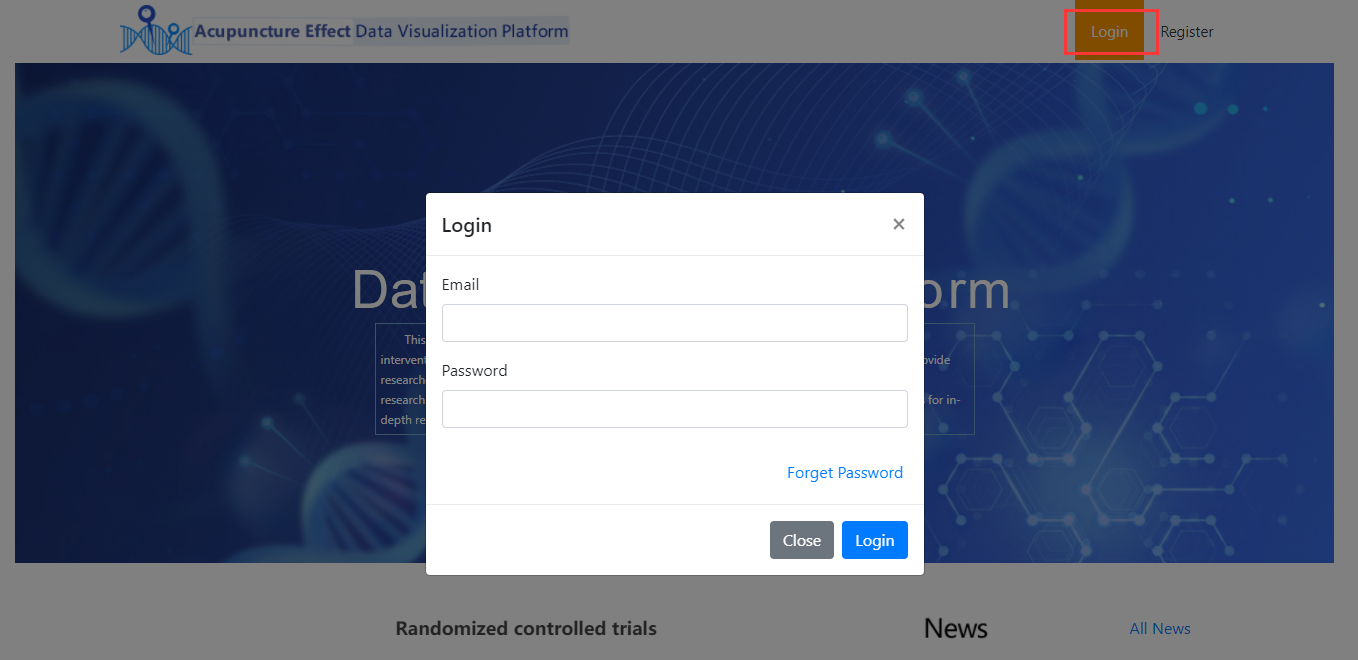
Click "Login" button, in the login window, please enter the registered email address and system login password, click "Login" button.
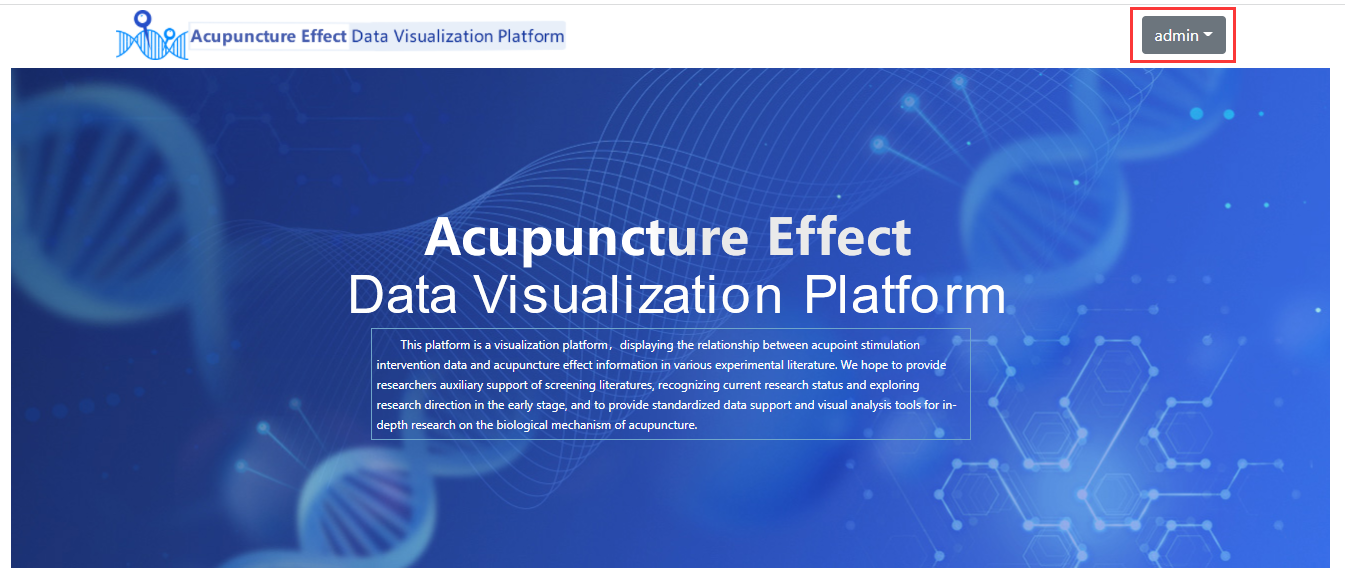
If your user name is shown in the upper right corner, you have successfully logged in to the system.
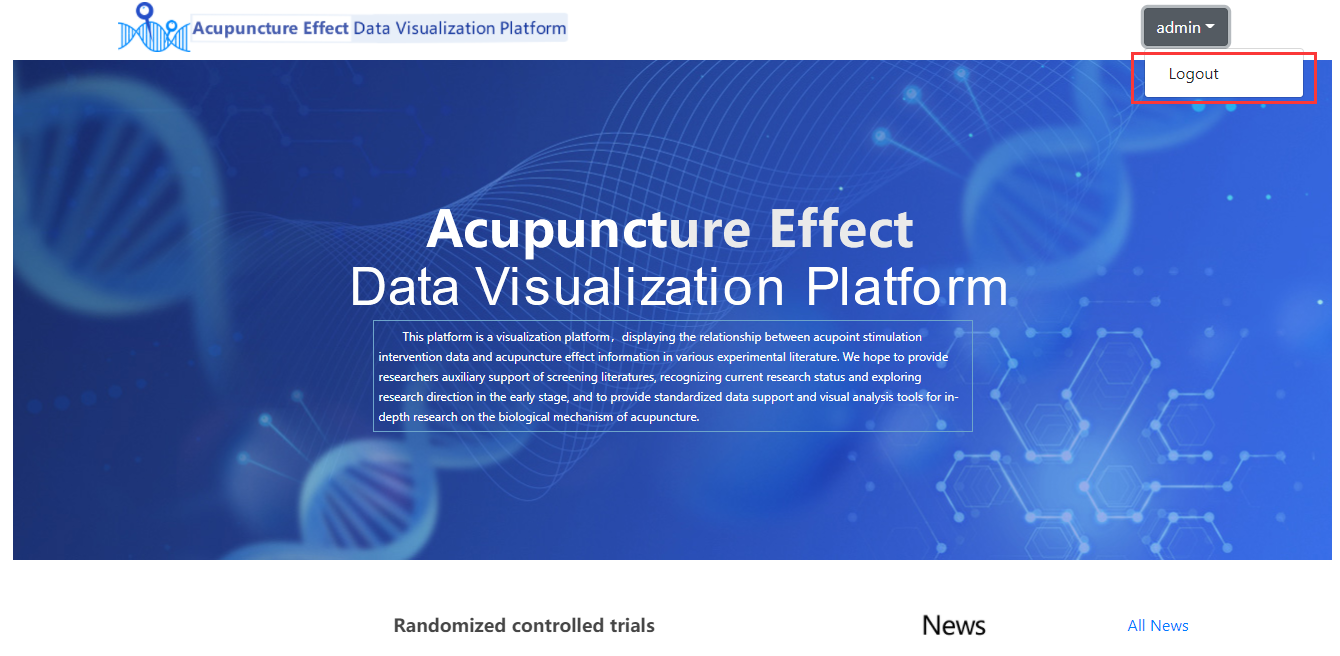
In the user name drop-down list, select "Logout" to log out of the system.
Lost Password
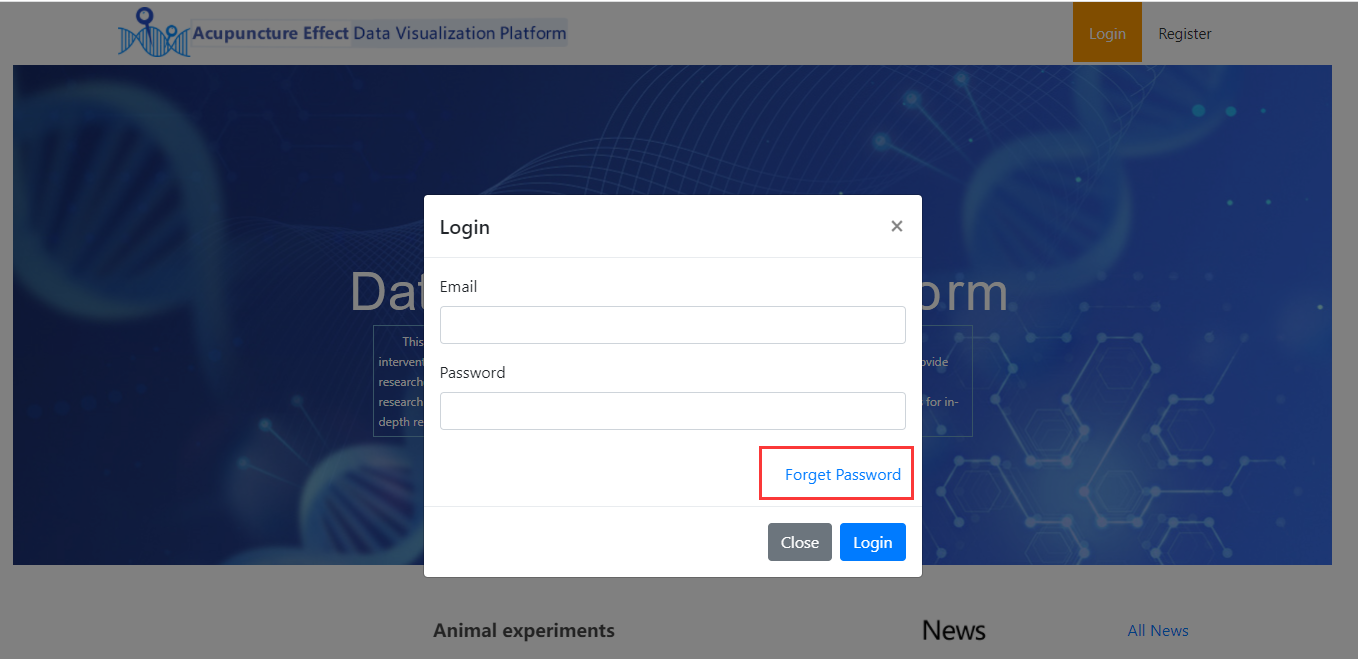
Click the "Login" button, and in the login window, click the "Forgot password" link.
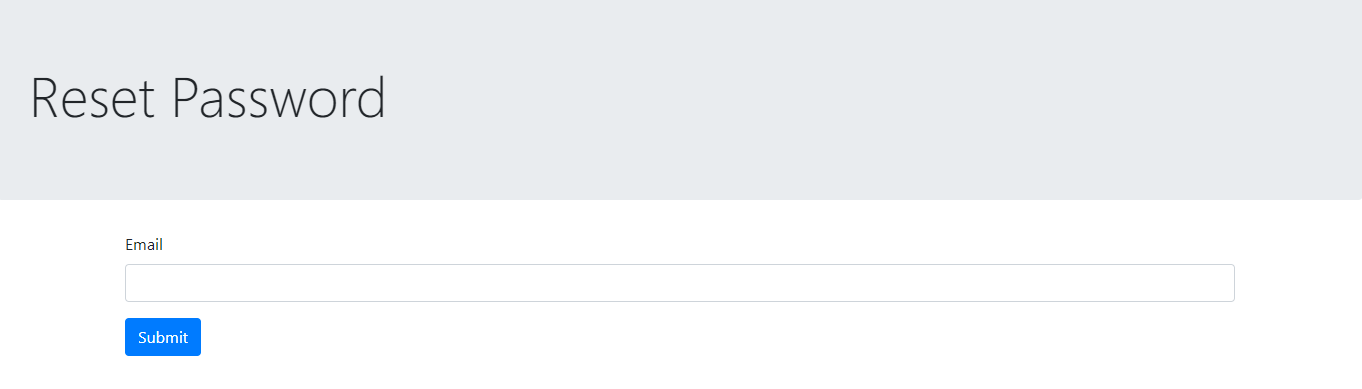
Enter the email address you used to register and click the "Submit" button.
System prompt "The verification code has been sent to the registered email address. Please log in to the email address to change the password."
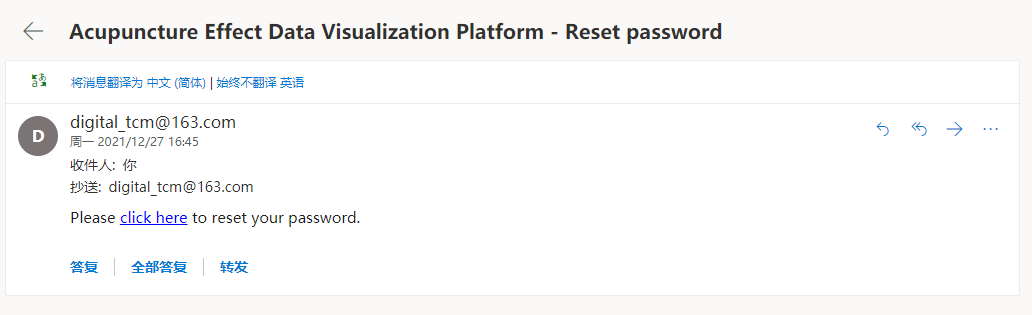
Log in to the registered mailbox and check the email with forgotten password.
Click the change password link
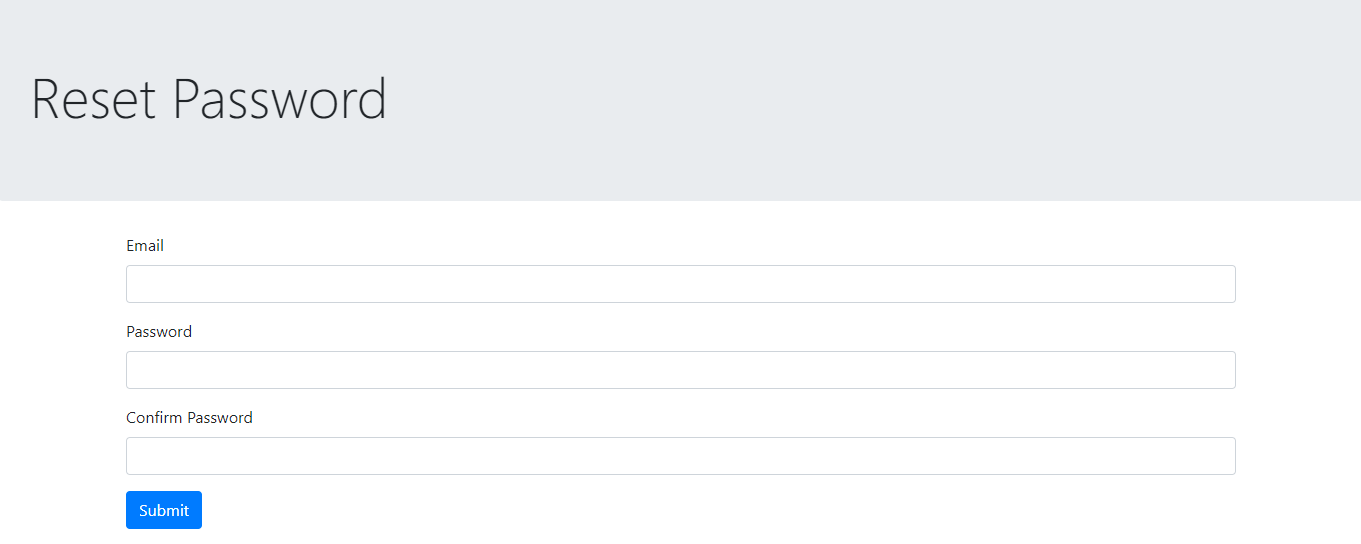
Enter your email address and new password and click the "Submit" button.
The system displays "The modification succeeded. Please return to the home page and log in again." To log in to the system with the new password.
Keyword Search
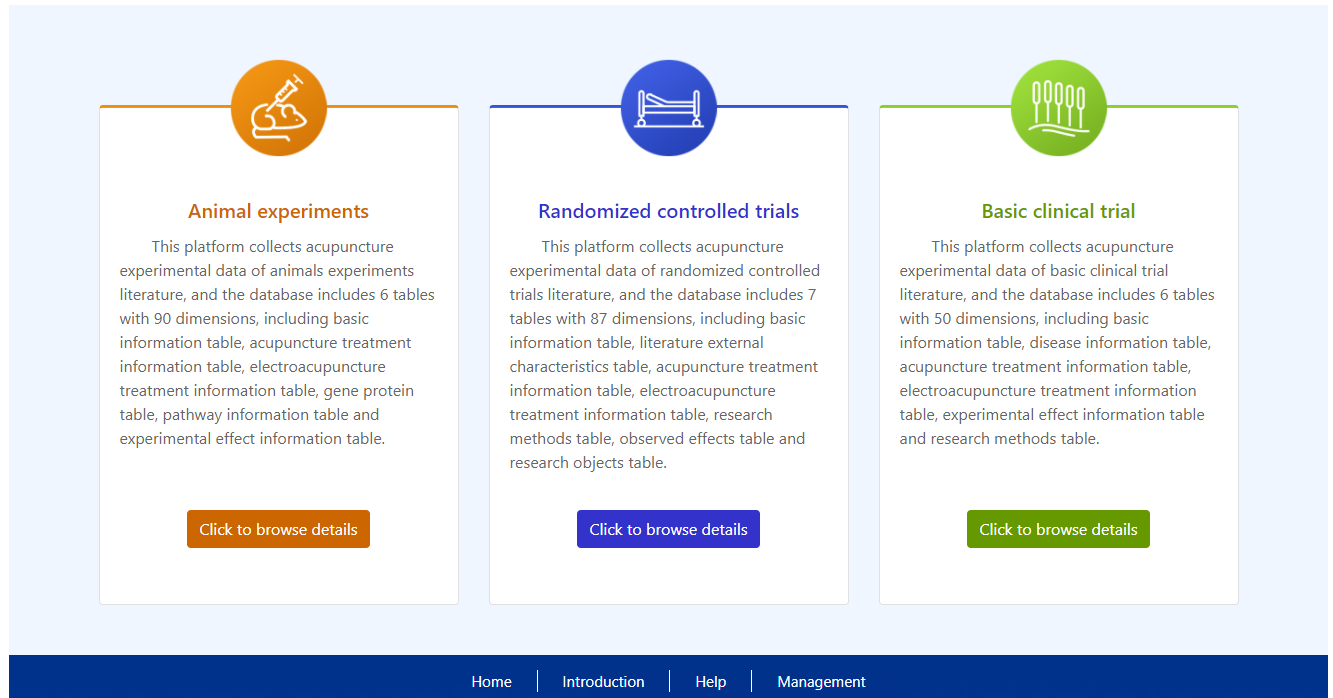
After logging in to the system, you can use the retrieval function of three modules: "Animal experiment", "randomized controlled trial" and "clinical basic experiment".
Click the "Click to browse details" button. You can enter the corresponding module.
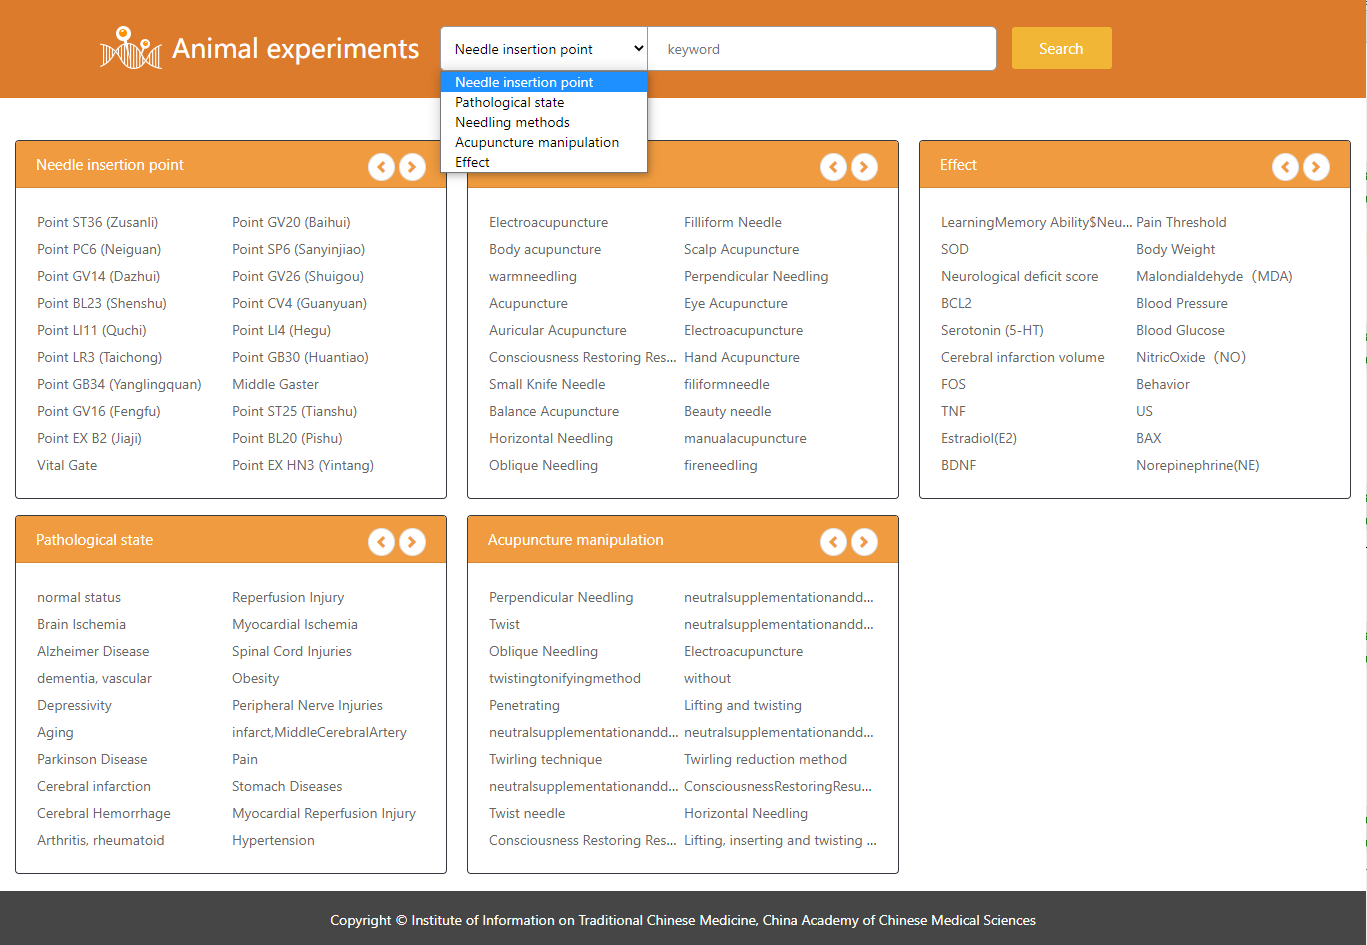
The home page of the module displays high-frequency keywords in each search entry.
Users can first in the search entry drop-down menu, select the search entry, and then in the input box, enter the keyword to search; You can also directly select the keyword link in the keyword list for retrieval.
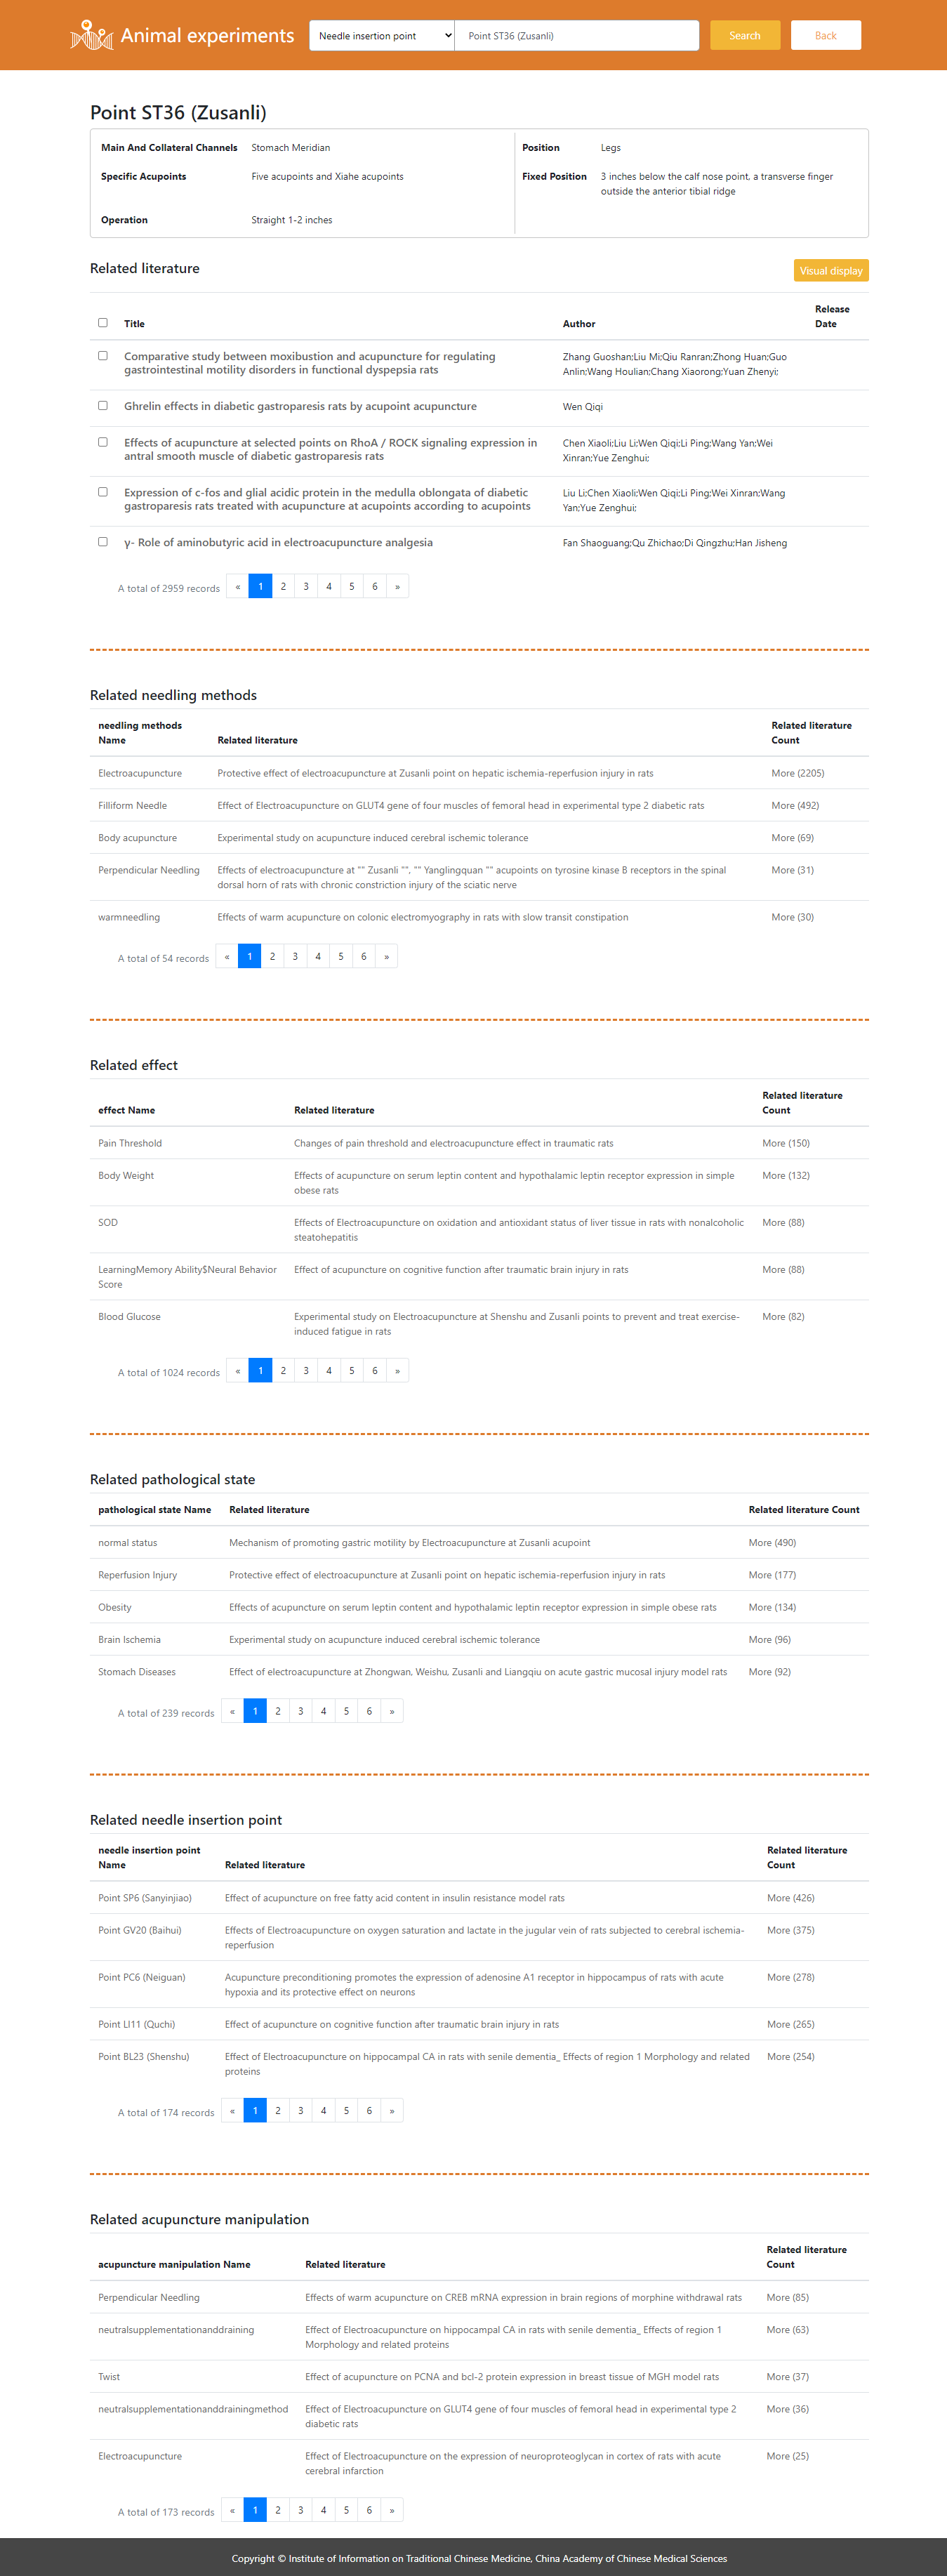
Retrieval results include: concept attributes, related literature and other relevant information.
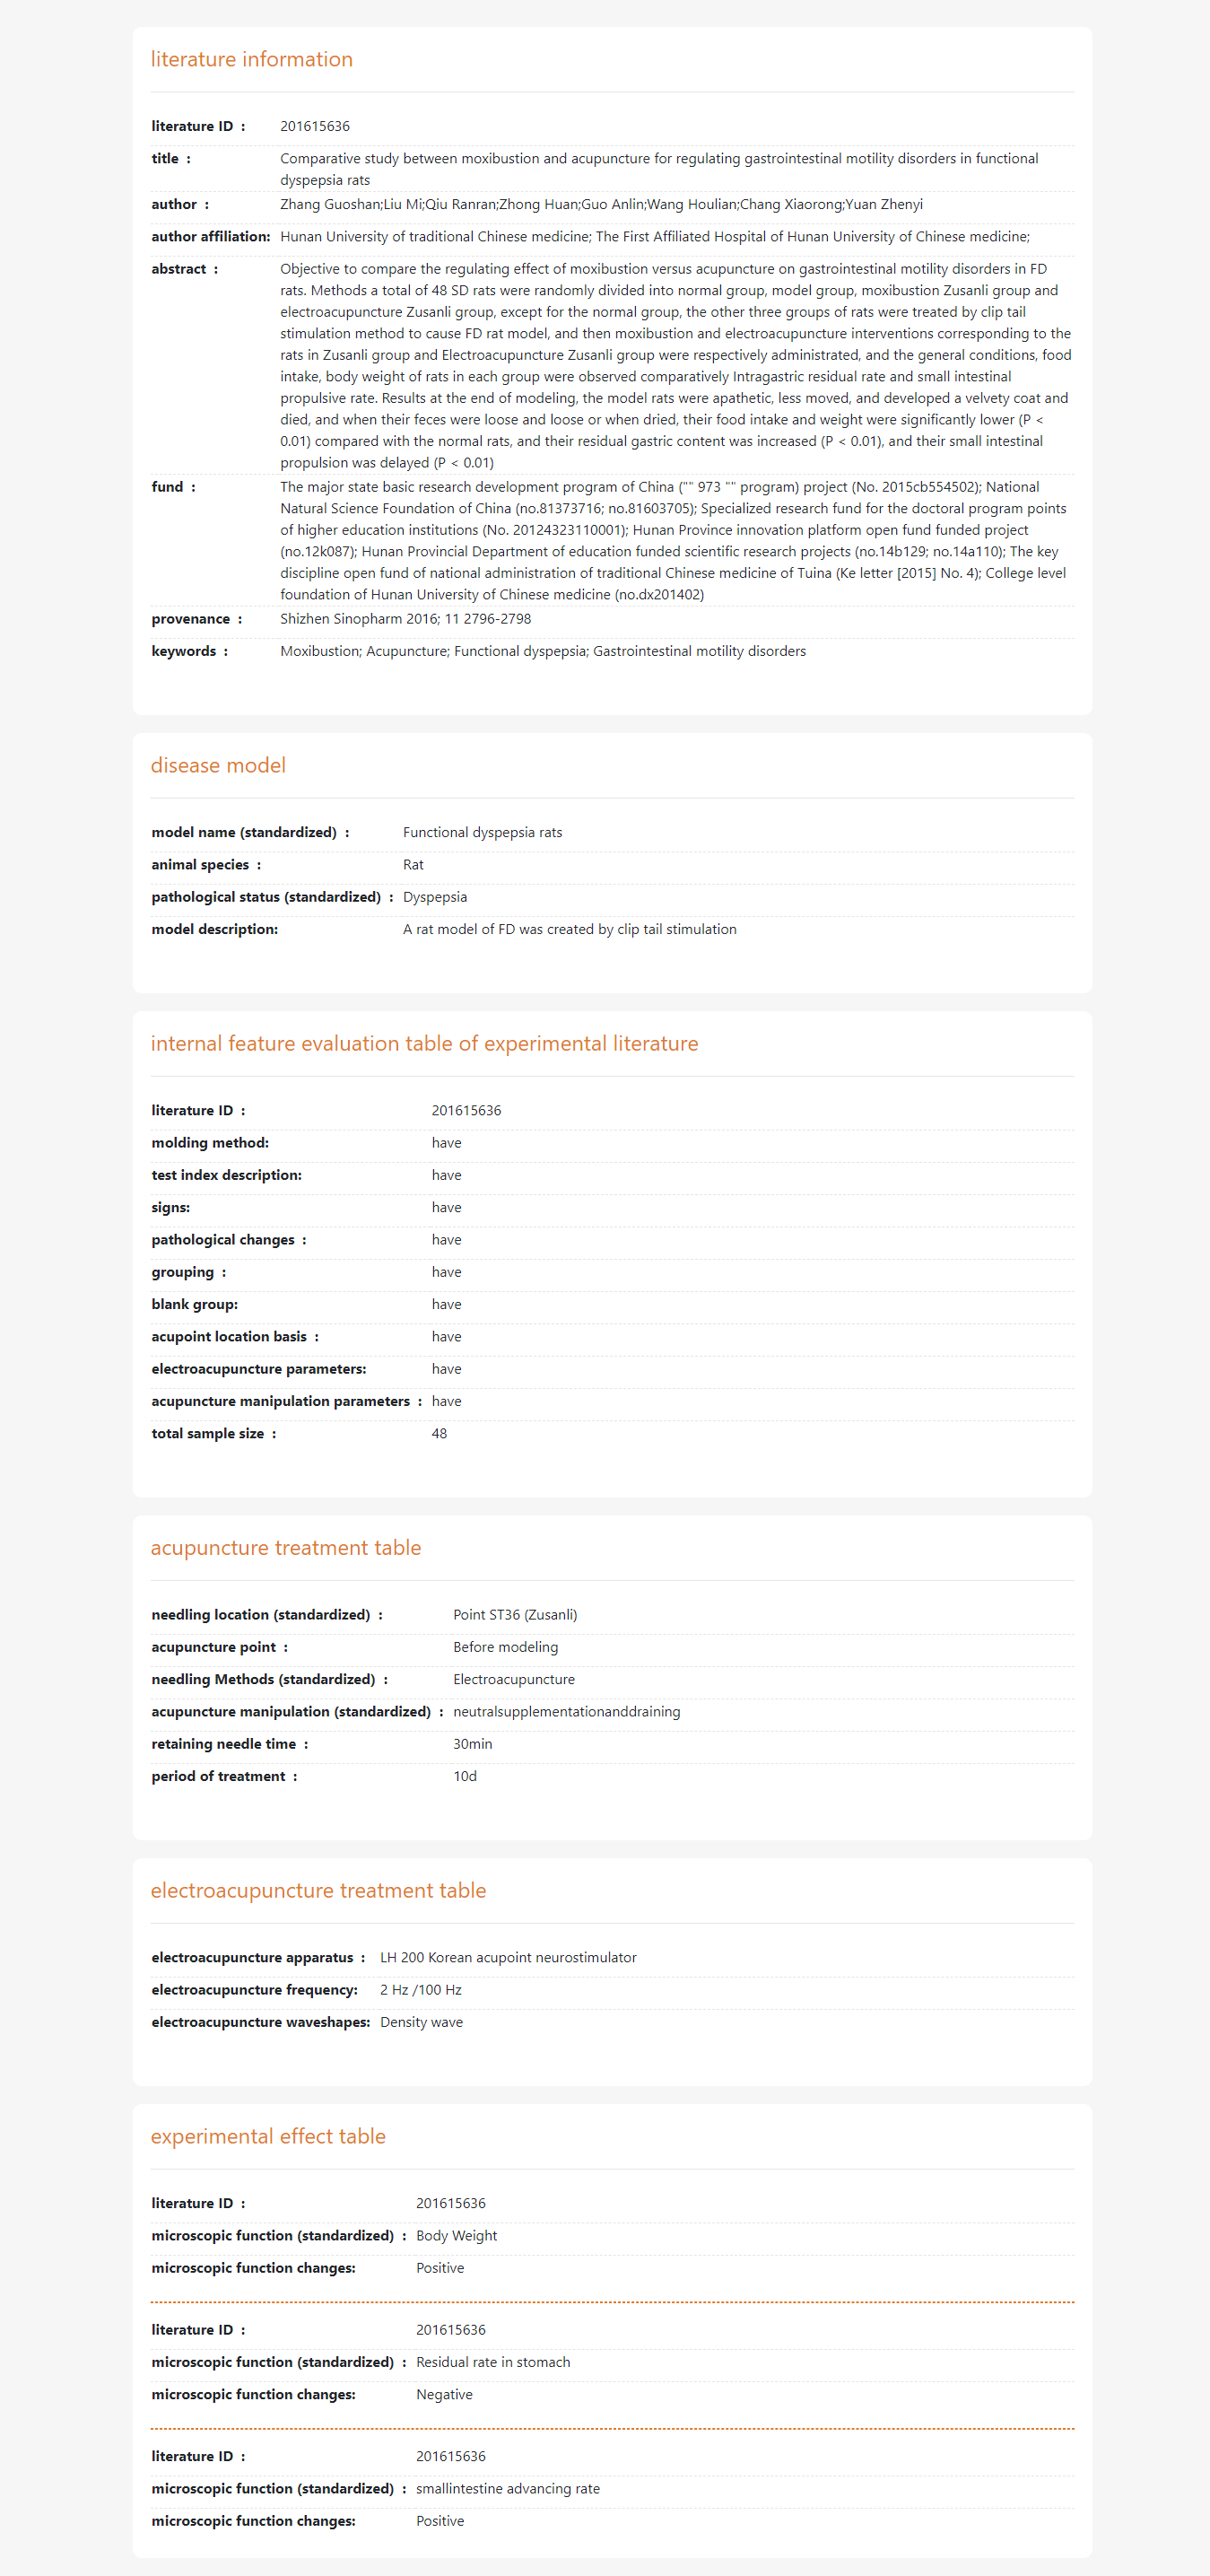
Click the literature name hyperlink to view the literature details.
Visualization
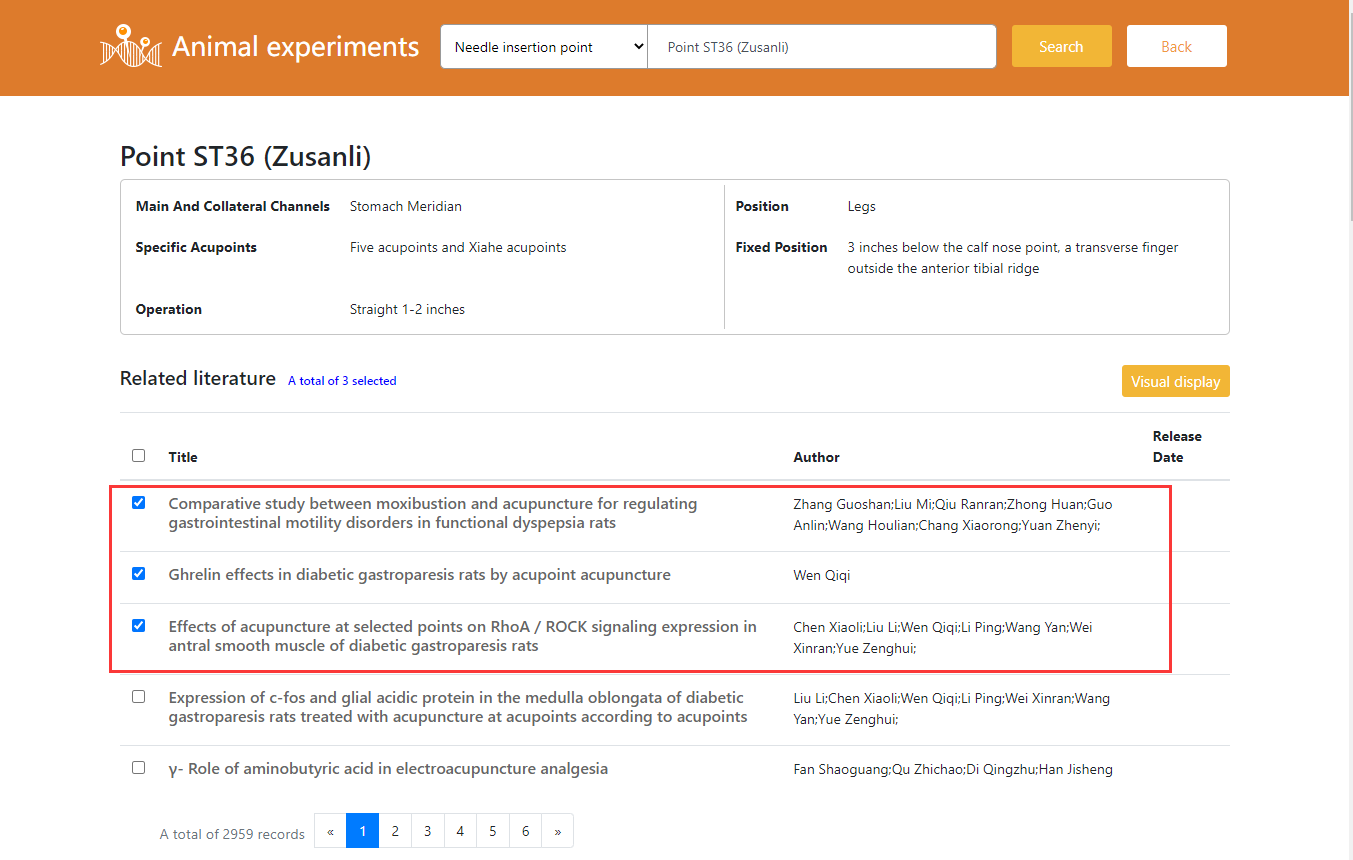
Select several documents (maximum 10, cross-page selection is supported) and click the "Visual Display" button.
You can view and delete selected literatures by clicking the hyperlink "** selected literatures" on the right of relevant literatures.
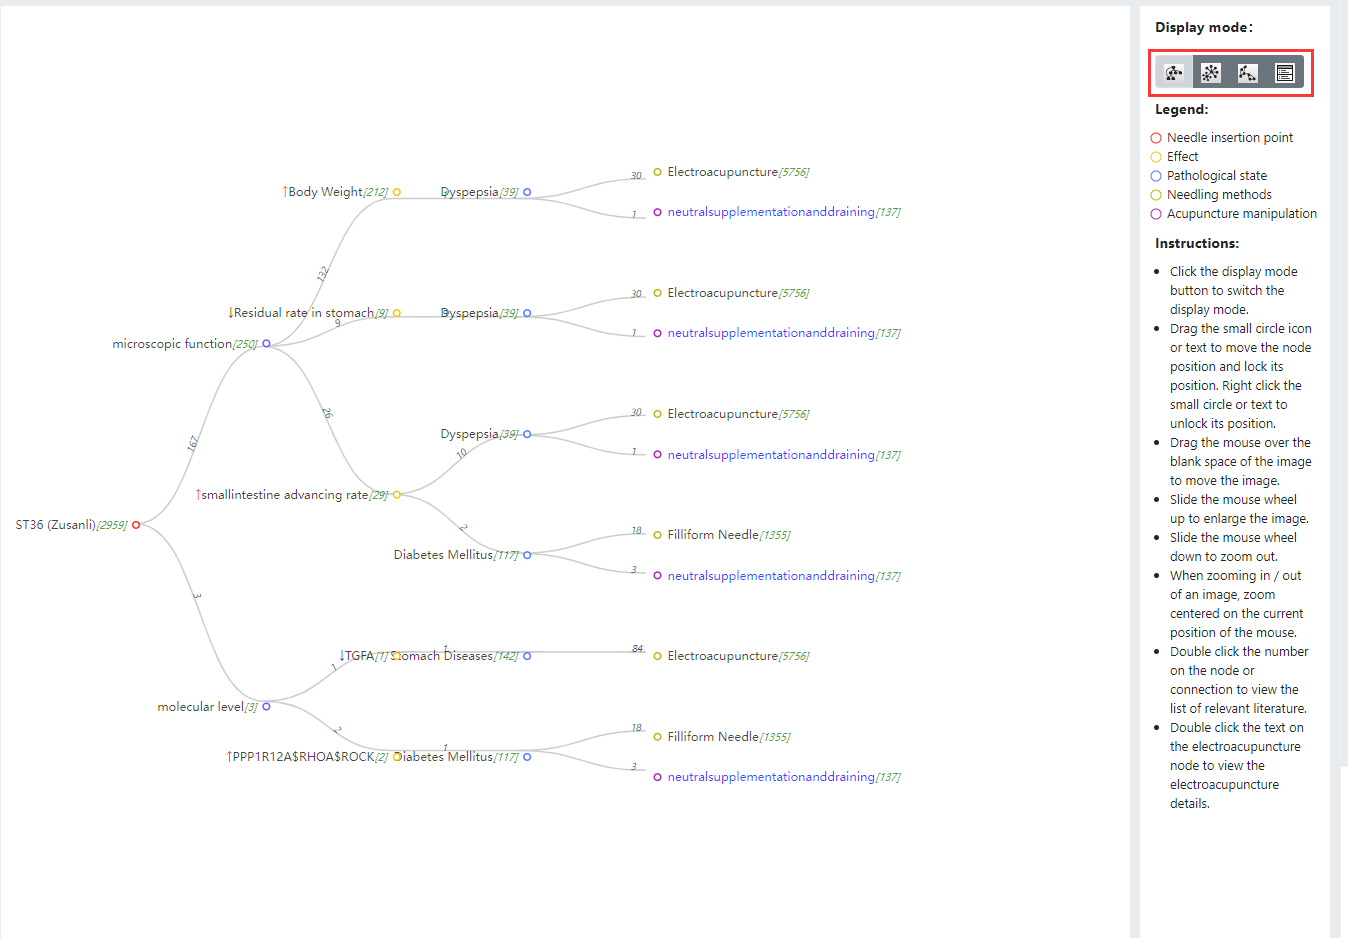
Data visualization is divided into four modes: tree visualization mode, circular visualization mode, mesh visualization mode and table mode.
Users can freely switch modes in the display mode.